All posts by Financial Independence Hub

Self-employed? 5 tips on meeting the June 15th tax-filing deadline

By Lisa Gittens, Tax Expert at H&R Block

Special to the Financial Independence Hub

With more than half a million Canadians entering the ranks of self-employment each year according to Statistics Canada, the self employed are truly a (work) force to be reckoned with. As such, they should also be reminded their tax return deadline is just around the corner, on June 15th.

If you carried on a business in 2016 [sole proprietorship with a December 31st year-end: see Editor’s Note at the end of this blog], you should file by that date to avoid a late-filing penalty. And although penalties can be avoided if you file on time, it’s important to note that interest will still be charged on any balance due from May 1st 2017.

If you’ve recently joined the ranks of self-employment or have been self-employed for many years, here are a few pointers that can help you file this tax season:

Are you self-employed?

Although most people know if they are self-employed, generally speaking, you fall under this category if you retain control of how and when you do the work, supply your own tools to get the work done and run a financial risk if the venture is unsuccessful. Examples of the self-employed include Uber drivers, freelancers and small-business owners.

Some employers, however, treat their employees as self-employed when they should not be classified as such in order to avoid payroll taxes. If you are unsure of your status, be sure to request a ruling from the Canada Revenue Agency.

When to claim GST/HST

Continue Reading…

U.S. Corporate Bonds: Taking all the credit

Investment-Grade Spread (RS) vs. High-Yield Spread (LS)

By Kevin Flanagan, WisdomTree Investments

Special to the Financial Independence Hub

Without a doubt, one of the better-performing sectors in the fixed-income arena over the last year or so has been the U.S. corporate bond market. Indeed, both the high-yield (HY) and investment-grade (IG) asset classes have enjoyed visibly positive returns both in 2016 and thus far in 2017, with HY registering specifically robust readings. Against this backdrop, questions have surfaced as to whether these types of performance can be sustained for the remainder of 2017.

And here we are, roughly five months into the calendar, and the question remains: Can the U.S. corporate bond market continue to produce positive outcomes? Oftentimes, market participants tend to focus on more recent trends, and in the process apply their findings to determine whether an asset could be overbought or oversold. In order to put recent developments in U.S. corporates into some perspective, we thought it would be a useful exercise to take a look at how HY and IG spreads have fared over a longer period (See chart at the top of this blog.)

So, where exactly are U.S. corporate bond spreads? According to the Bloomberg Barclays U.S. Aggregate Corporate Index, IG spreads have narrowed by 10 basis points (bps) since the end of the year, and stood at 113 bps as of this writing. This is the lowest level since the latter half of 2014. On the HY front, the Bloomberg Barclays U.S. Corporate High Yield Index shows the spread at 376 bps, a decline of 33 bps from the year-end 2016 tally, and also resides at levels last seen almost three years ago.

A slightly more dramatic way of looking at the current readings is to focus on how much these spreads have come in since the recent high watermarks were posted in February of last year. From this key risk-off period, IG spreads have declined by more than 100 bps, and an eye-popping 463 bps for HY. It is this combination of recent spread-narrowing and current levels that has prompted the aforementioned questions.

Some historical perspective

This is where some historical perspective is in order, specifically: Have we entered uncharted territory? Continue Reading…

Millennial Money: Can Money buy Happiness?

By Brandon Hill, CFP

Special to the Financial Independence Hub

Do you believe the saying money can’t buy you happiness? Most people laugh at that notion, while some of the wealthiest people sing its praises …

I recently read a book called Happy Money: The Science of Happier Spending by Elizabeth Dunn and Michael Norton.

The book set out to tackle the question – “Just because money often fails to buy people happiness, does that mean that it can’t?”

Luckily it can:  it just depends on how you go about spending it. It turns out that our everyday spending choices releases a variety of biological and emotional effects – either positive or negative.

This book covers five specific spending strategies to spark positive effects and increase happiness. You may have heard of some – such as buy experiences, not “things.”

The goal is to maximize the amount of happiness you get out of every dollar you spend.

Some of the wealthiest individuals have mastered these tactics (Bill Gates / Warren Buffett) and don’t let their wealth become a source of anxiety or stress.

It’s important to note that these ideas aren’t supposed to encourage you to spend your way to happiness. All strategies are meant for your discretionary spending, after your needs and future savings goals are taken care of (see my previous article on Guilt-free Spending).

All of the ideas written about here are completely attributable to the authors of this book and include paraphrased ideas and/or direct quotes from the authors. I don’t take credit for the concepts written here. The full book is a quick read and if you are interested in reading more in-depth, you can buy a copy here.

Buy Experiences

A study found out that once an individual makes $75,000 or more (in the US), any increase in income has no effect on their everyday general happiness. Isn’t that crazy?
Continue Reading…

Can I afford to Retire?

The following is the second excerpt from Create the Retirement You Really Want: And Retire Smarter, Richer and Happier

By Clay Gillespie

Special the Financial Independence Hub

It was a beautiful May morning when I next saw Rachel and Mike. Rachel was carrying a large gift-wrapped box.

“This is for you,” she said, smiling and handing the box to me.

“Thank you,” I said, pleasantly surprised. “Most of my clients wait until they see how their portfolio performs before expressing their appreciation.”

“Shall we take it back then?”

“No, no! I’ll keep it,” I said, smiling, as I began to slide off the ribbon and remove the wrapping.

I opened the lid, looked inside and grinned with pleasure. “Much appreciated,” I said, looking proudly at a genuine leather soccer ball with my daughter’s name custom-printed on the top panel. “Sarah’s going to love it!”

“We wanted to give you a memento of our first meeting,” Rachel said.

“How very appropriate. Well, I don’t have a soccer ball for you,” I said, putting the ball down. “But hopefully I have an equally useful gift.”

“One that will last a lifetime?” Rachel asked.

“Yes. You might say it’s a gift that keeps on giving,” I said, grinning and handing them each a file folder.

“Our retirement numbers?” Mike asked.

“Yes. These are your illustrations.”

“Will we need to eat cat food?” Mike asked with a smile.

“No.” I laughed. “My goal is to help you maximize your retirement income, not minimize it.”

“And we won’t outlive our money?” Mike asked, more serious now.

“You should have plenty left for your children, unless you live to be Methuselah’s age.”

“Methuselah lived to be 969 years old,” Rachel said. “So I think the odds of that happening to us are slim,” she said pointedly.

“Right. My mistake,” I admitted. “I’ve taken the liberty of including a life expectancy table in your retirement illustration, so you’ll know the odds.”

“The odds of us dying at a certain age? I’m not sure I’m ready to see that!” Mike said uneasily.

“Don’t be such a worrywart, Mike,” Rachel said, chiding him gently. “It’s not as if you’re going to see the exact date and time of your death.” Suddenly, she frowned and looked at me. “Are we?”

“No,” I said smiling. “The actuaries aren’t that good, at least not yet. The life expectancies I’ve included are estimates based on a number of factors including your current age, your diet, exercise frequency, stress, body fat, genetics and the quality of health care.We’ll get to those in a moment. What you’re about to see is a financial illustration. It’s designed to give you an initial picture of your retirement situation for planning purposes. But first, we need to review your finances together so we’re all on the same page. Agreed?”

“Agreed,” they said together.

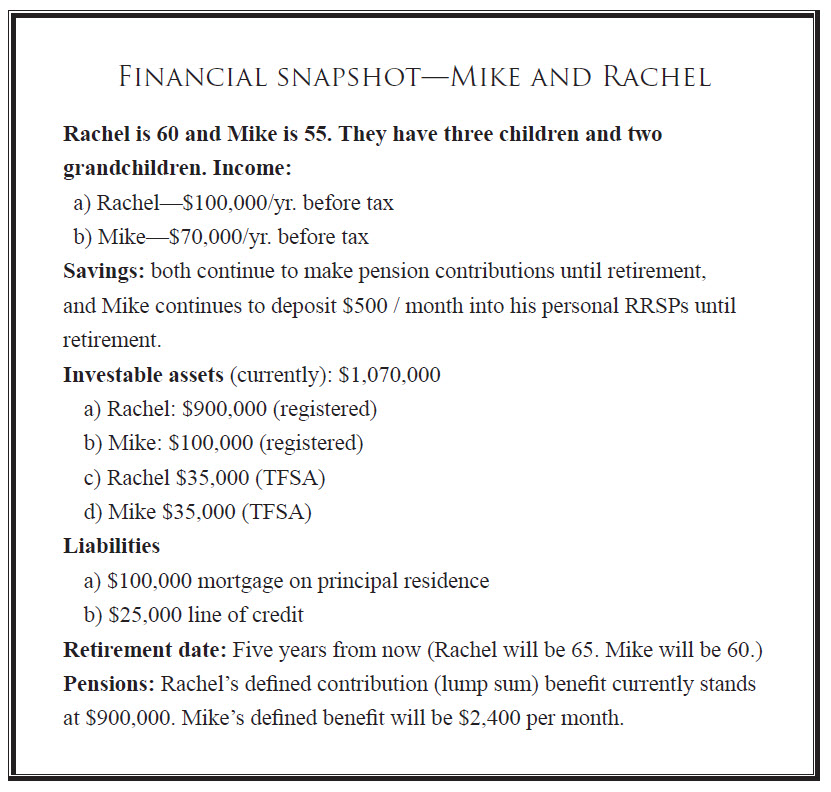
“Good. Here’s a quick snapshot of your current finances. As we go through it, I want you to let me know if anything is amiss.”

This is what they saw:

“As you can see, your gross income is $170,000 per year, while your combined income after tax is approximately $125,000.” “We work hard for our income,” Rachel said defensively.

Continue Reading…

Do you believe in the Inflation Bogeyman?

U.S. CPI vs. U.S. CPI ex-Food & Energy Year-over-Year Change from 1/31/2010 to 4/30/2017

By Kevin Flanagan, WisdomTree Investments

Special to the Financial Independence Hub

One of the lynchpins behind the Federal Reserve’s (Fed) decision-making process thus far in 2017 has apparently been the altered inflation landscape. The policy makers seem to be more comfortable that deflationary conditions have passed and that inflation will be “running close to the Committee’s 2 per cent longer-run objective.” Does that mean that fixed-income investors should be fearful of the inflation bogeyman rearing its ugly head anytime soon?

Calendar year 2017 did get off to a somewhat unexpected start on the inflation front. Indeed, the Consumer Price Index (CPI), perhaps the most widely followed gauge on price developments, revealed some visible upside during the winter months. According to the Bureau of Labor Statistics (BLS), overall CPI rose as high as +2.7%1 in February on a year-over-year basis, the strongest performance in five years.

In fact, as recently as July of last year, the figure came in as low as +0.8%2. The Fed’s preferred measure of inflation, the price index for personal consumption expenditure (PCE) exhibited a similar pattern, coming in at a five-year high watermark of +2.1%3 and crossing the FOMC’s mentioned 2% threshold in the process.

Core inflation slowing

Interestingly, inflation has not exhibited any further upward momentum in the months that followed. To provide some perspective, the year-over-year gains for CPI and the PCE price index have since dropped back to +2.2%4 and +1.8%5, respectively, in the latest data available. Continue Reading…